Putting a Number on Shaft Stiffness
Can We Quantify The Feel of a Golf Shaft?
What constitutes feel or relative stiffness of a golf club? You’ll find there are many theories on defining how stiff a golf club (or shaft) are compared to another. Today I want to share with you a different perspective on defining this delicate subject and hopefully opening your mind to other possibilities or explain what you may have experienced in the past.
Is there a standard for shaft flex?
First, you need to understand one thing; the only standard in the golf industry is “there are there no standards”. When you buy a club with an R-flex in it, you may find that it feels different from other R-flex shafts. Some of the factors include the lack of standardization for flex or could be the overall weight, bend point of stiffness distribution as well as torque.
What is a Golf Frequency Analyzer?
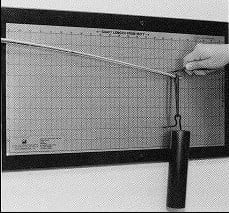
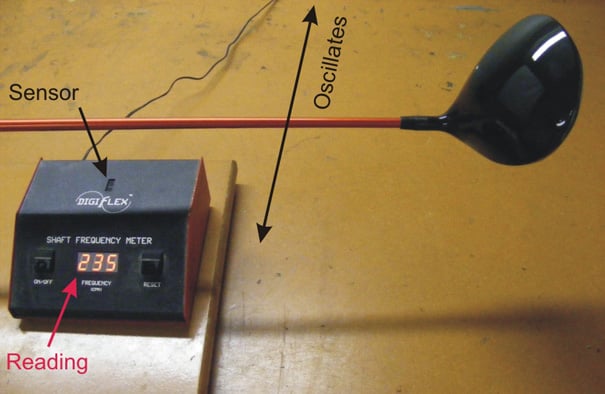
Today, frequency analyzers are commonly used as another way to define the stiffness of a club by clamping the butt end and plucking the head to put it into motion. The frequency analyzer measures these movements and calculates how many cycles per minute (cpm) the shaft would oscillate over the sensor. The higher the number of oscillations meant the shaft was moving faster and would be considered a stiffer club than one with a lower cpm. Again this is only true if we are comparing clubs of the same length.
What is a EI Shaft Profiler?
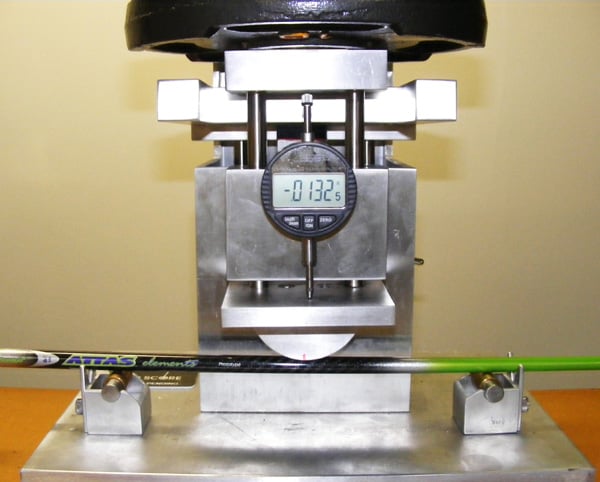
Last year we added a new piece of equipment to our shaft testing lab to help better quantify shaft stiffness and to educate clubmakers and customers alike to help select the right shaft. Our EI shaft profiler is a 3-point bending test that measures the deflection along a span of the shaft. By taking measurements from the tip to the butt and plotting the results provides a more comprehensive look at the shaft’s stiffness distribution and a better understanding of how that shaft will react.
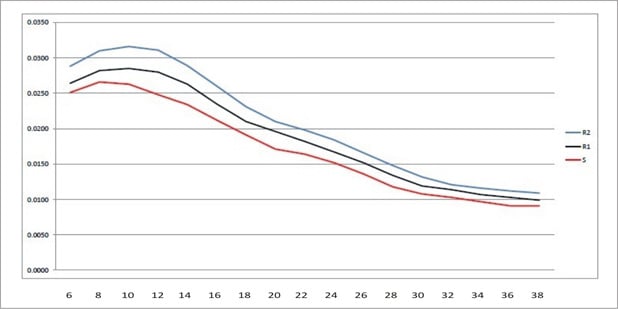
It is not the most glamourous job as you have to carefully move the shaft to each exact location, reset the dial indicator to zero, lower the weight and record the amount of deflection and then repeat this step over and over and over. Well here is an example of a graph of deflections readings of 3 flexes of the same family of shaft.
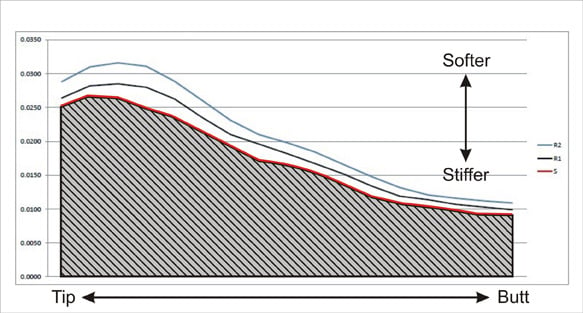
To make this easier to understand, let’s blow up the chart and makes some notes. The left side of the chart represents the tip end. The plot is an accumulation of 17 data points measuring 2” closer to the butt. The lower the position on the chart; the stiffer the shaft is at any given point. Yes, the butt end is stiffer than the tip due to the larger cross section or diameters. The red line is the S-flex, black line is the R1 flex (standard regular) and the blue line is the R2 flex (commonly referred to as senior or A flex).
Since it is the same family of shaft (in this case the Graphite Design Tour AD BB 5), the shape of the curve is very similar. The only difference is the more flexible shafts exhibit a greater amount of deflection.
A Different Way to Look at Shaft Stiffness
To put this all in perspective, one way to quantify feel in is to examine the summation of all the individual deflections along the entire length of the shaft. In other words we want to look at the area under the curve (shaded area). If we were to look at the area under the black curve, it would be larger and the blue line even a little more.
This leads us to our next topic. Clubmakers rely on frequency analyzers to take a quick measurement of the stiffness of a club or even a shaft by itself with some sort of weighted object attached. Again you have to compare frequencies at identical lengths otherwise you are not comparing apples to apples. But let’s say we have three shafts of all the same frequency, length and similar weight. Should all those shafts feel the same? Many would incorrectly assume so.
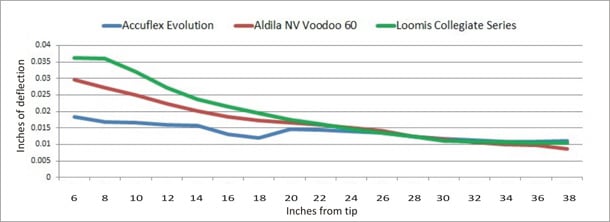
There is another factor in shaft fitting that is important to remember and that is the stiffness distribution or what some may say is the bend point or kick point of the shaft. Here are three R-flex shafts that we tested that had the same frequency, very similar weight, but their deflection curves varied considerably, especially near the business end of the club (head).
From about the 22” point from the tip all the way to the butt end, these shafts all had nearly identical deflections readings. It may not come as much surprise as the shafts had the same frequency which is measured by clamping the butt end. The blue line represents the Accuflex Evolution. Although this shaft is no longer manufactured, I can tell you it was one very tip stiff shaft and always felt much firmer overall than other shafts of similar frequency. The red line represents the Aldila NV Voodoo 60 which is considered a mid-trajectory shaft by the manufacturer. Lastly, the green line represents the Loomis Collegiate Series, which is said to be more high-to-mid launching.
Now let’s tie in what we learned earlier. The less area under the curve would result into a stiffer shaft. Even though each of these shafts is the same exact frequency and similar weight, the Evolution (blue) should feel the stiffest and the Loomis Collegiate (green) the most flexible of the three.
Relationship Between Torque and Shaft Flex
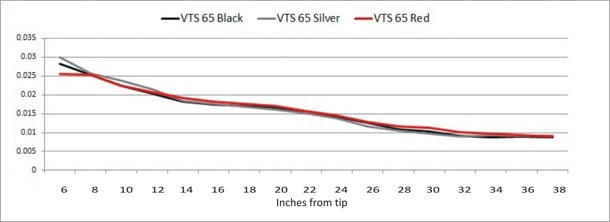
Back in 2011, I reported on the UST-Mamiya VTS series that was recently introduced. UST Mamiya was able to produce shafts of the same weight, butt, mid and tip flex, but with 3 different torques, each 1 degree apart or what they said was the minimum threshold at which golfers could feel. The shafts are colored coded to indicate the torque. The Black is the lowest torque version. Silver is the mid torque version or 1º higher than the black. Lastly Red is the highest torque version of 1º higher than the silver. The higher the torque was to provide a softer feel of the grouping.
Here are the deflection profiles of the 65 gram S-flex series. At first glance they appear to overlap once another. This should come as no surprise. After all, there were designed to be the same stiffness, stiffness distribution and weight. But there are little nuances with each shaft if you were to look at the individual deflections and measure the area under the curves. The Black (or lowest torque) had the least amount of area under its curve signifying the stiffest “feel”. The Silver was next and the Red exhibited the highest amount of area under the curve.
So what is the real reason for the difference in feel? Remember, In order to alter the torque and maintain everything else requires the materials to be applied at different angles along the shaft forming mandrel and these can alter the deflections along the length of the shaft. For years our DSFI (Dynamic Shaft Fitting Index) was based on torque as well as frequency. Now we have another way to put a number on feel.
